Digit Analysis
Why LDP Analyzer Keeps Losing for Deriv Bots
Discover why your ldp analyzer keeps losing on Deriv bots. Learn how to fix stake sizes, stop loss, and take profit settings. Test strategies for free today.
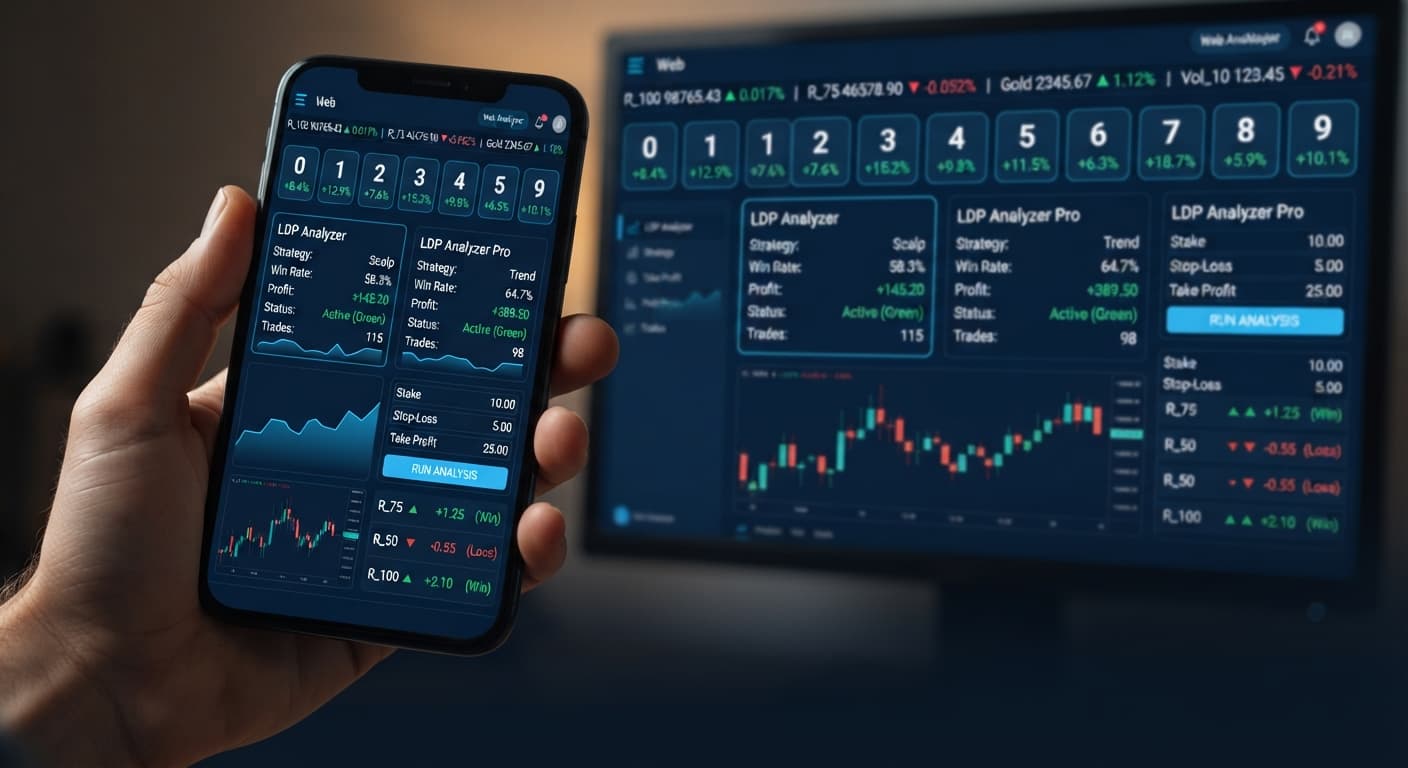
If you're weighing up ldp analyzer vs ldp analyzer pro, the choice comes down to interface depth and trade automation. Choose LDP Analyzer if you want a clean digit stream breakdown for manual trading or basic setups. Pick LDP Analyzer Pro if you need a 0–9 digit heatmap, dedicated DIFFER/MATCH target tools, and full automated strategy execution.
Both applications run inside your browser without downloads or software installations. You paste your personal API key directly into the application, which subscribes to live market ticks over a direct API connection. Nothing passes through external server databases; every order goes straight to your own Deriv balance. Whether you build manual workflows or run automated deriv bots, picking the right tool saves time and keeps your execution clean.
Before looking at specific setups, here is how the two tools differ across key operational features:
| Feature Dimension | LDP Analyzer | LDP Analyzer Pro |
|---|---|---|
| Digit Visualisation | Real-time last-digit stream list | Live stream plus a full 0–9 digit heatmap |
| Execution Method | Manual triggers and standard automated strategy execution | Automated execution engine with target filters |
| Target Selection | Broad digit monitoring | Explicit DIFFER and MATCH digit targets |
| On-Screen Risk Controls | Deriv API token connection, market selector, stake, stop loss, take profit | Deriv API token connection, market selector, stake, stop loss, take profit |
| Contract Types | DIGITEVEN, DIGITODD, DIGITOVER, DIGITUNDER, DIGITMATCH, DIGITDIFF | DIGITEVEN, DIGITODD, DIGITOVER, DIGITUNDER, DIGITMATCH, DIGITDIFF |
| Supported Index Markets | Volatility 10, Volatility 25, Volatility 50, Volatility 75, Volatility 100, plus 1s variants | Volatility 10, Volatility 25, Volatility 50, Volatility 75, Volatility 100, plus 1s variants |
| Hosting Model | 100% browser-based API connection | 100% browser-based API connection |
| Account Types | Deriv Demo (virtual) and Real accounts | Deriv Demo (virtual) and Real accounts |
Different trade setups demand different layouts on your monitor. Standard real-time digit analysis works well when you keep your execution simple and clean.
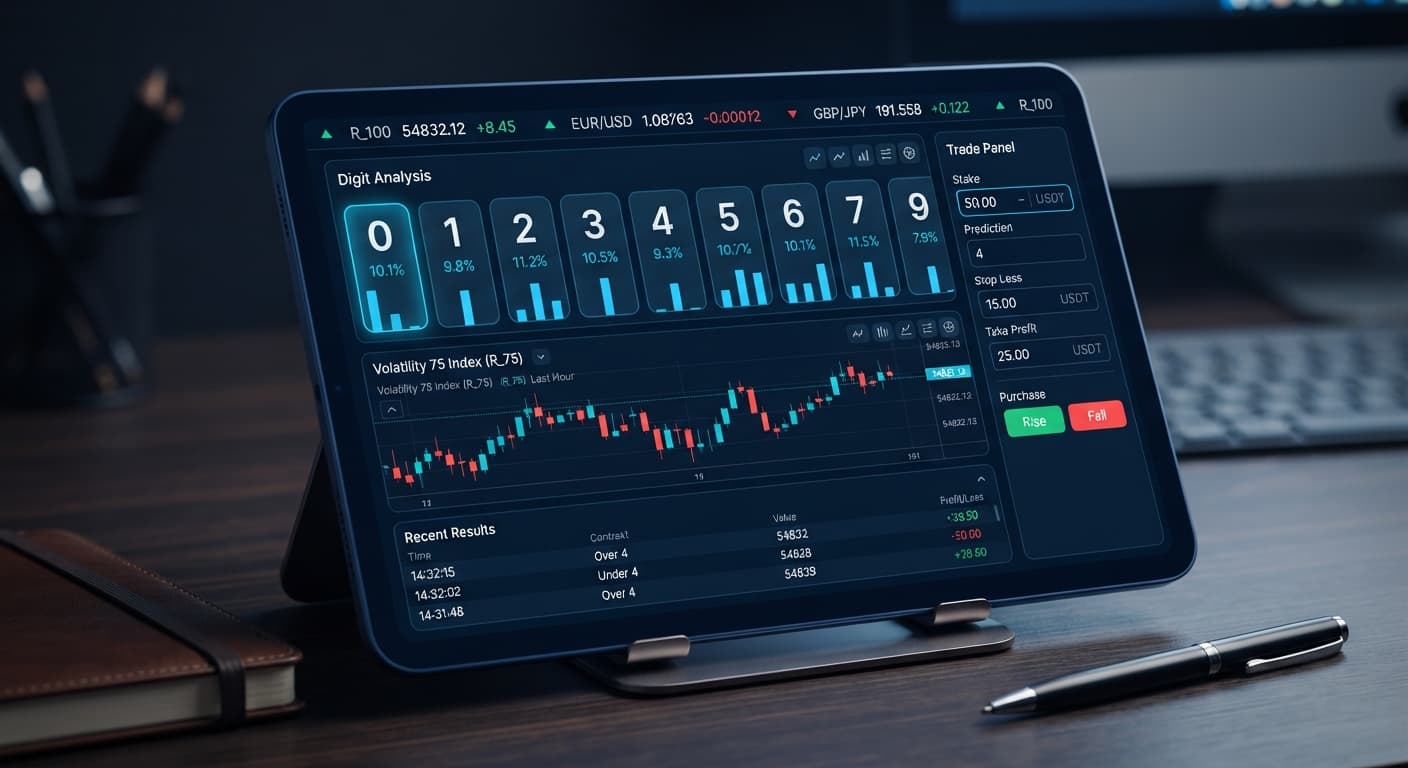
If you trade DIGITEVEN or DIGITODD contracts on Volatility 75 Index, you don't need a noisy visual grid. You only need to see whether recent tick endings favor odd or even numbers. You open the standard tool, paste your key into the Deriv API token connection field, use the market selector to choose your index, set your stake to $1.00, and enter your stop loss and take profit limits before turning the run switch on. It gives you raw digit frequency without clutter.
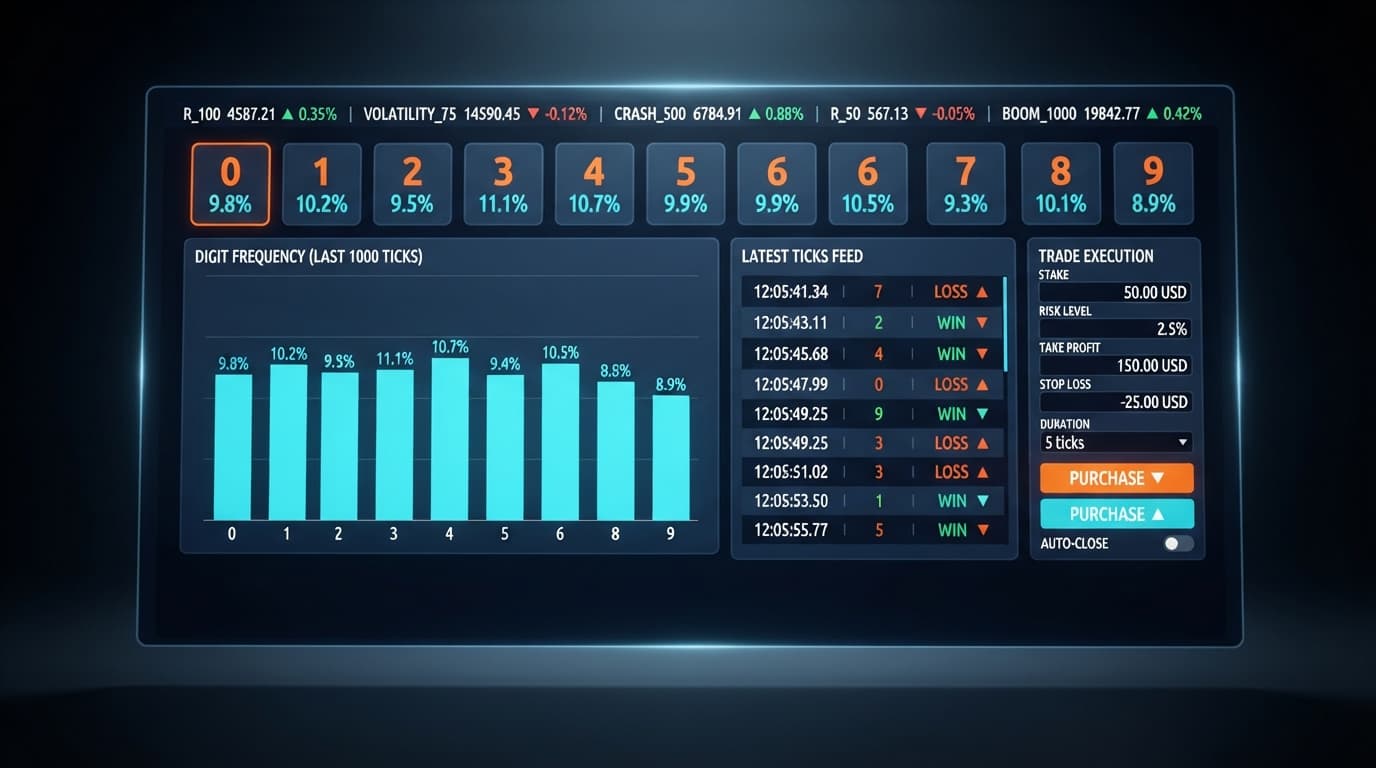
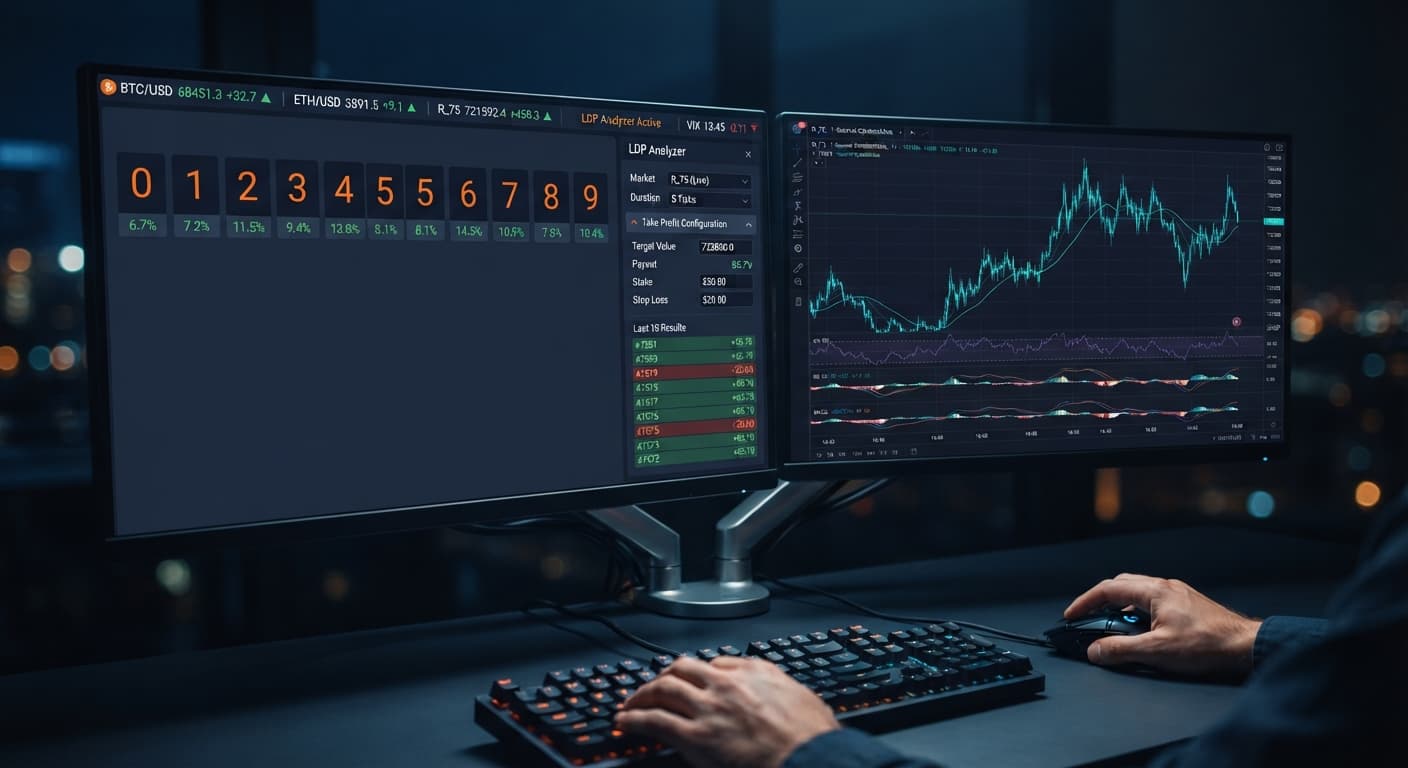
If you focus on DIGITDIFF or DIGITMATCH contracts, the Pro version becomes essential. When trading DIGITDIFF, you're placing capital on the prediction that the next last digit will not equal your target digit. To make that call systematically, you need to see which single digit from 0 to 9 has appeared most or least often over recent ticks. The 0–9 heatmap in Pro updates instantly with every tick, highlighting cold digits that haven't appeared for extended runs.
Traders who build automated binary bots prefer Pro when running multi-condition entries. If your strategy waits for digit 7 to stay hidden for 20 ticks before automatically placing a DIGITDIFF contract against digit 7, Pro handles both the frequency monitoring and automated order placement without manual intervention.
No tool, software script, or visual heatmap can alter the underlying math of synthetic index markets. Deriv synthetic ticks are generated as independent random draws. A digit that hasn't appeared for 25 consecutive ticks still has an exact 1-in-10 (10%) statistical probability of appearing on the next tick. Past frequency distribution does not force future outcomes.
To evaluate any automated strategy execution, you must compute the mathematical break-even point against broker payouts.
On a standard DIGITDIFF contract, you win if the final digit does not match your target digit. Out of 10 possible outcomes (digits 0 through 9), 9 result in a win.
To find your required break-even win rate, use this formula: Break-even Rate = 1 / (1 + Payout Rate) Break-even Rate = 1 / (1 + 0.099) = 1 / 1.099 = 90.99%
Because your static win probability is 90.00% and your break-even threshold is 90.99%, trading randomly over thousands of ticks will lose money over time. The 0.99% gap represents the house margin built into contract pricing.
On a DIGITMATCH contract, you win only if the final digit matches your exact target.
Calculate the break-even hit rate: Break-even Rate = 1 / (1 + 8.0) = 1 / 9 = 11.11%
Your theoretical win rate is 10.00%, but you need an 11.11% win rate just to stand still.
These mathematical facts show why setting strict risk controls matters. You must define a realistic stop loss and take profit inside your parameters before launching any run. Relying on continuous runs to recover losses will eventually wipe an account balance when a random cold digit avoids appearing far longer than historical averages suggest.
You don't need to choose one application permanently. Most traders test ideas on the entry-level tool before deploying full automated strategies on Pro.
Open the app interface and input your token into the Deriv API token connection box. Always use a Deriv virtual account token first so you can test interface controls without putting real capital on the line.
Use the market selector to pick your preferred index, such as Volatility 100 Index or Volatility 10 (1s) Index. Type your initial bet amount into the stake input box (for example, $2.00). Enter a hard stop loss of $20.00 and a take profit target of $10.00. Setting these parameters before starting protects your balance if a bad streak occurs while you're away from the screen.
Select your contract type—choose from DIGITEVEN, DIGITODD, DIGITOVER, DIGITUNDER, DIGITMATCH, or DIGITDIFF. Watch the real-time digit stream output for 50 to 100 ticks. Pay attention to how quickly odd/even ratios swing or how often repeat digits land back-to-back.
When you identify entry rules that require single-digit tracking, open LDP Analyzer Pro. Use the 0–9 heatmap to locate dormancies or spike targets. If you're running DIGITDIFF trades on dormant digits, verify that your automated strategy triggers orders only when your exact rules are met.
Once your account profit hits the designated take profit value, stop the run. Don't leave automated web tools running continuously across changing market conditions. Re-evaluate your trade logs, check your win-loss ratios against theoretical break-even math, and adjust your rules before starting a new session.
Try running your own digit strategies on LDP Analyzer using a virtual demo balance.
If you don't have an active trading key ready, create a free Deriv account to generate one in seconds.
Trading involves risk. Past performance does not guarantee future results.
Related: Why LDP Analyzer Keeps Losing for Deriv Bots
Free LDP Binary Analyzer — AI-powered last-digit analysis for Deriv traders with real-time binary analysis and automated strategies.
Open LDP Analyzer →The standard LDP Analyzer provides a clean digit stream breakdown suited for manual trading or basic setups. LDP Analyzer Pro includes a full 0–9 digit heatmap, dedicated DIFFER/MATCH target tools, and a more advanced automated execution engine.
No, LDP Analyzer runs 100% in your browser without any downloads or installations. You just paste your Deriv API token directly into the app to connect to live market ticks.
LDP Analyzer Pro is essential for DIGITDIFF and DIGITMATCH trades because it features a live 0–9 digit heatmap. This heatmap lets you track which single digits are appearing most or least often over recent ticks to help make your systematic calls.
Yes, LDP Analyzer supports both Deriv Demo virtual accounts and Real accounts. You simply connect your personal API token, select your market, and set your risk controls regardless of which account type you use.
Guides closest to this one.
Discover why your ldp analyzer keeps losing on Deriv bots. Learn how to fix stake sizes, stop loss, and take profit settings. Test strategies for free today.
Read our comprehensive ldp analyzer review for binary bots. Learn digit analysis, supported markets, and risk management tools on Deriv. Try it today!
Set your ldp analyzer take profit settings to 2% to 5% of your total account balance or 2 to 4 times your stake to lock in automated gains.