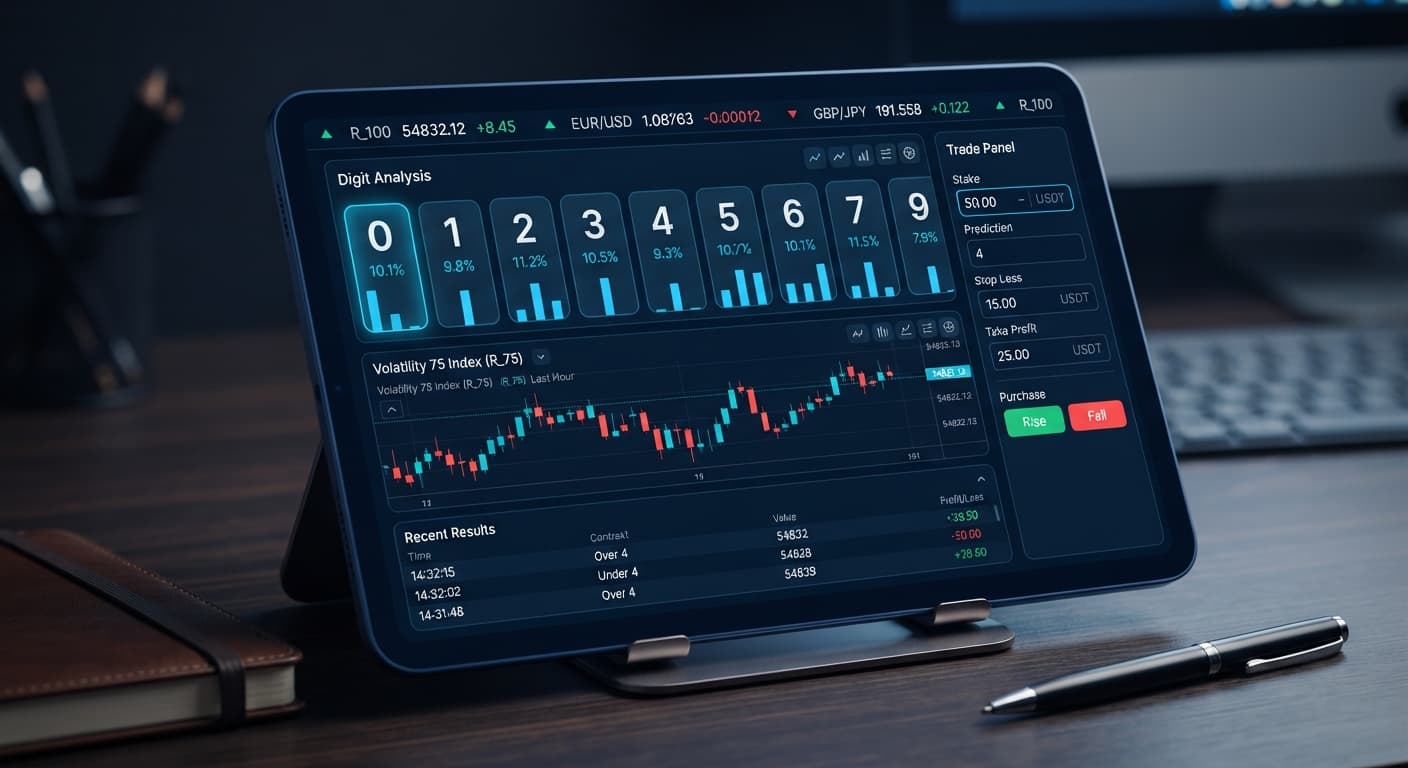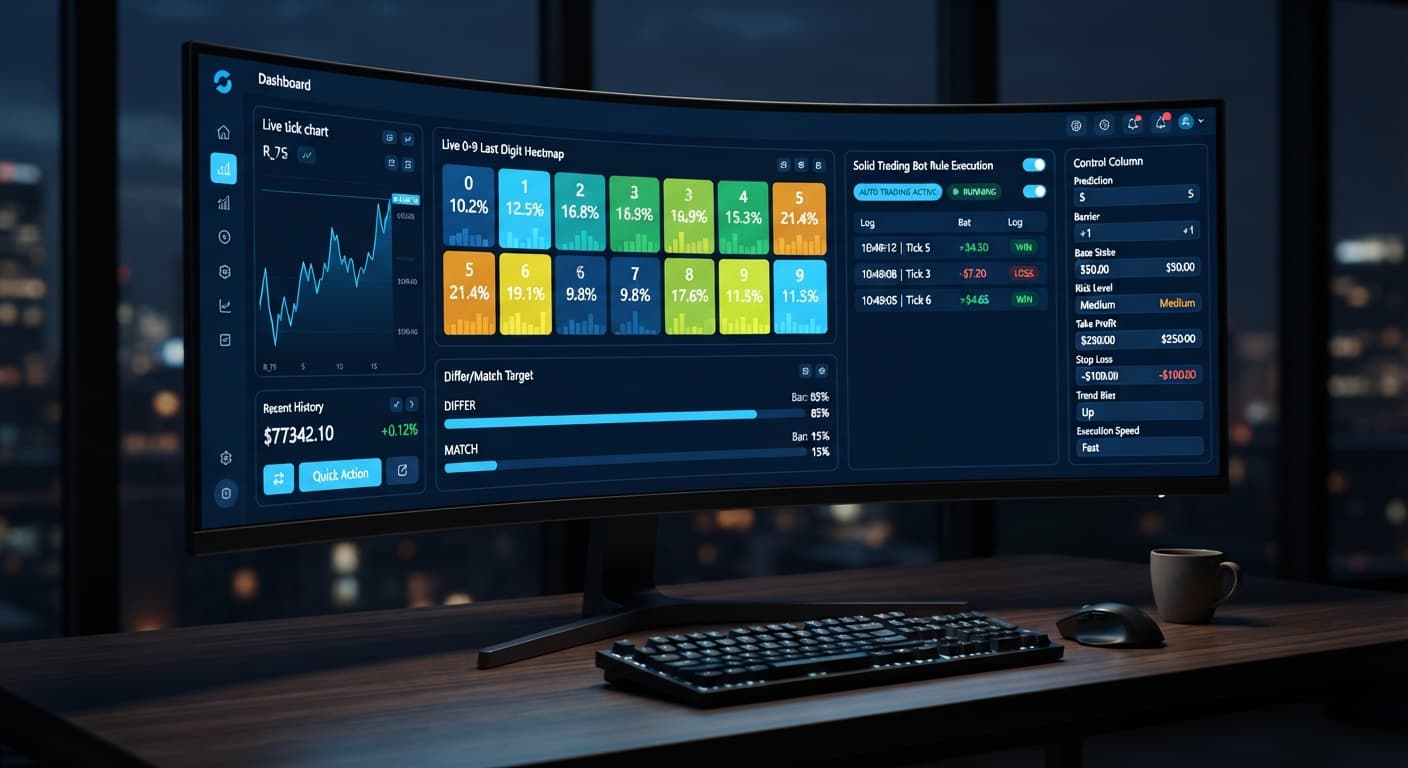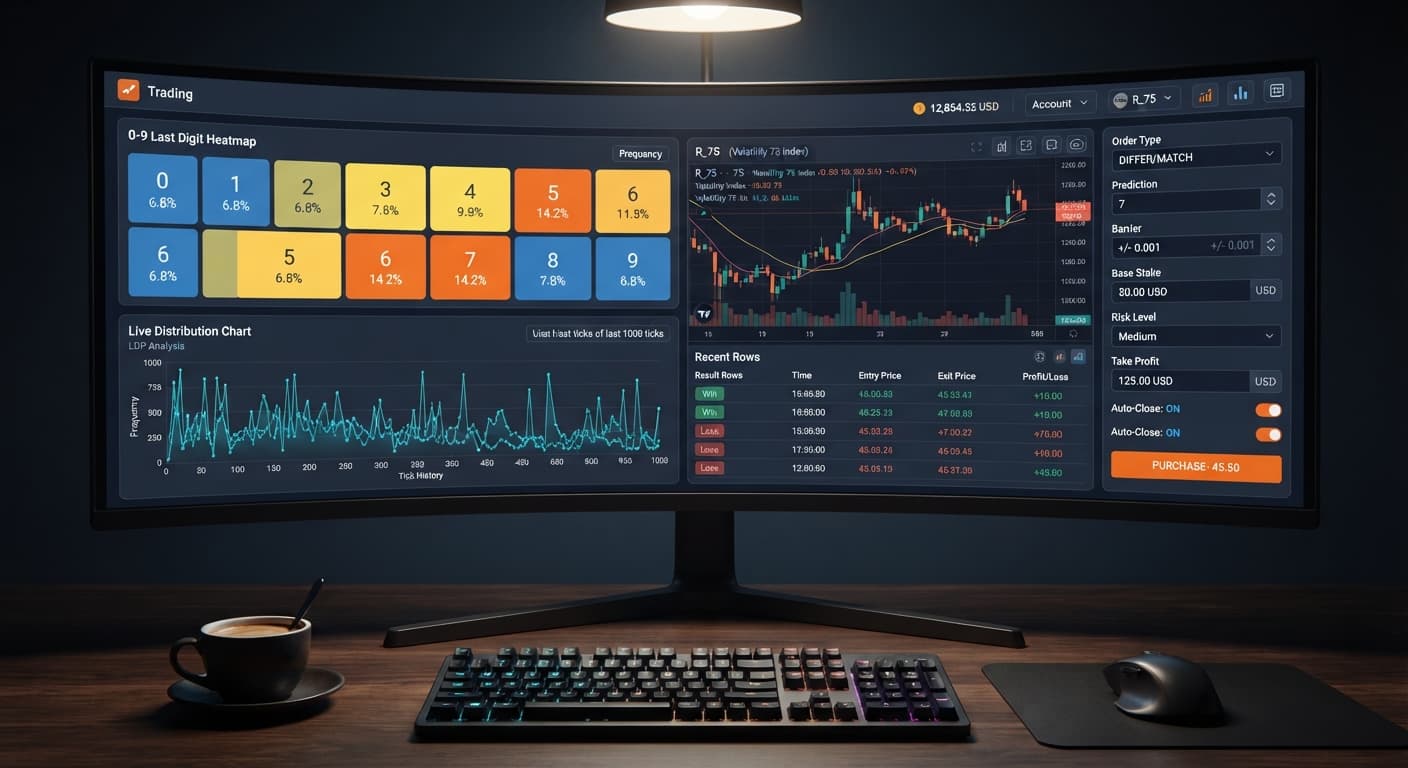
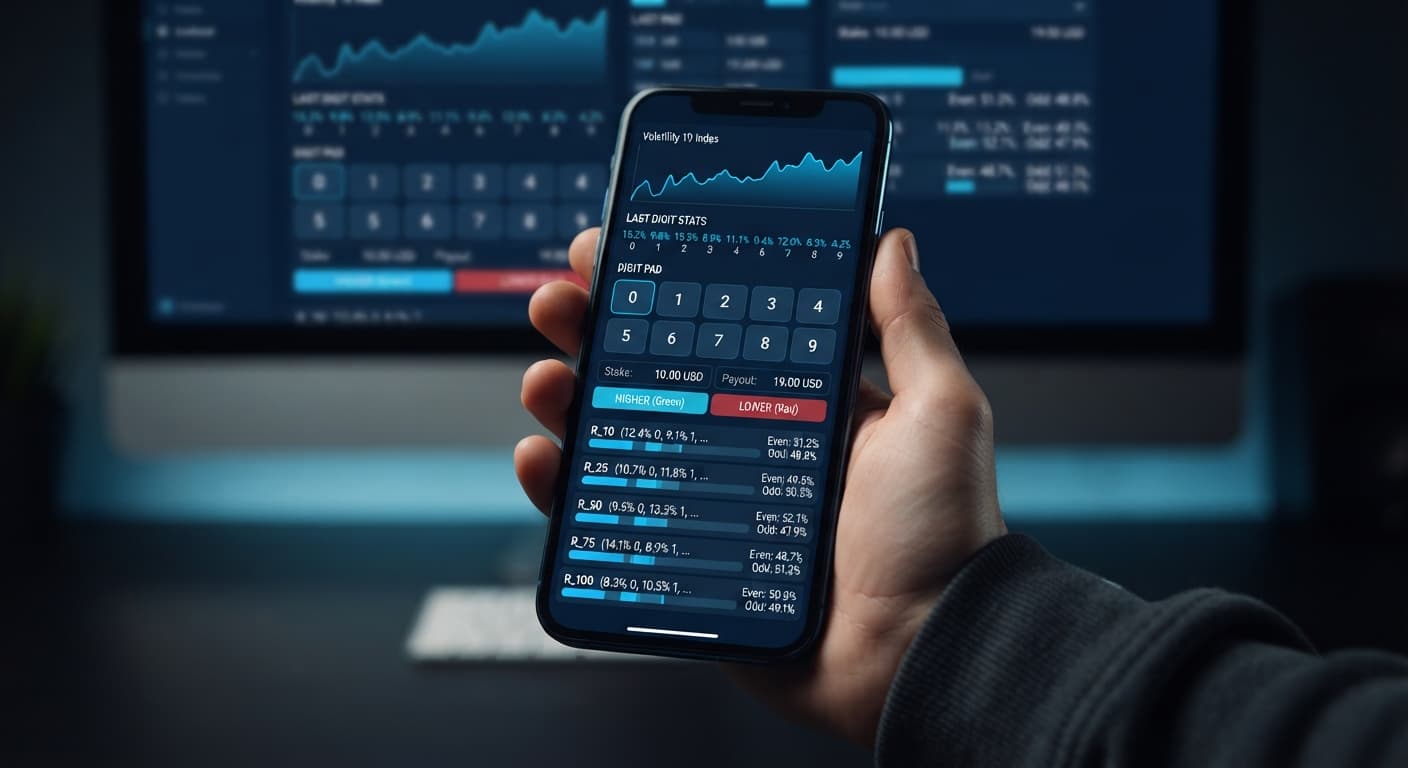
Digit Analysis
How to Use Digit Pad on Volatility 10 for Manual Trades
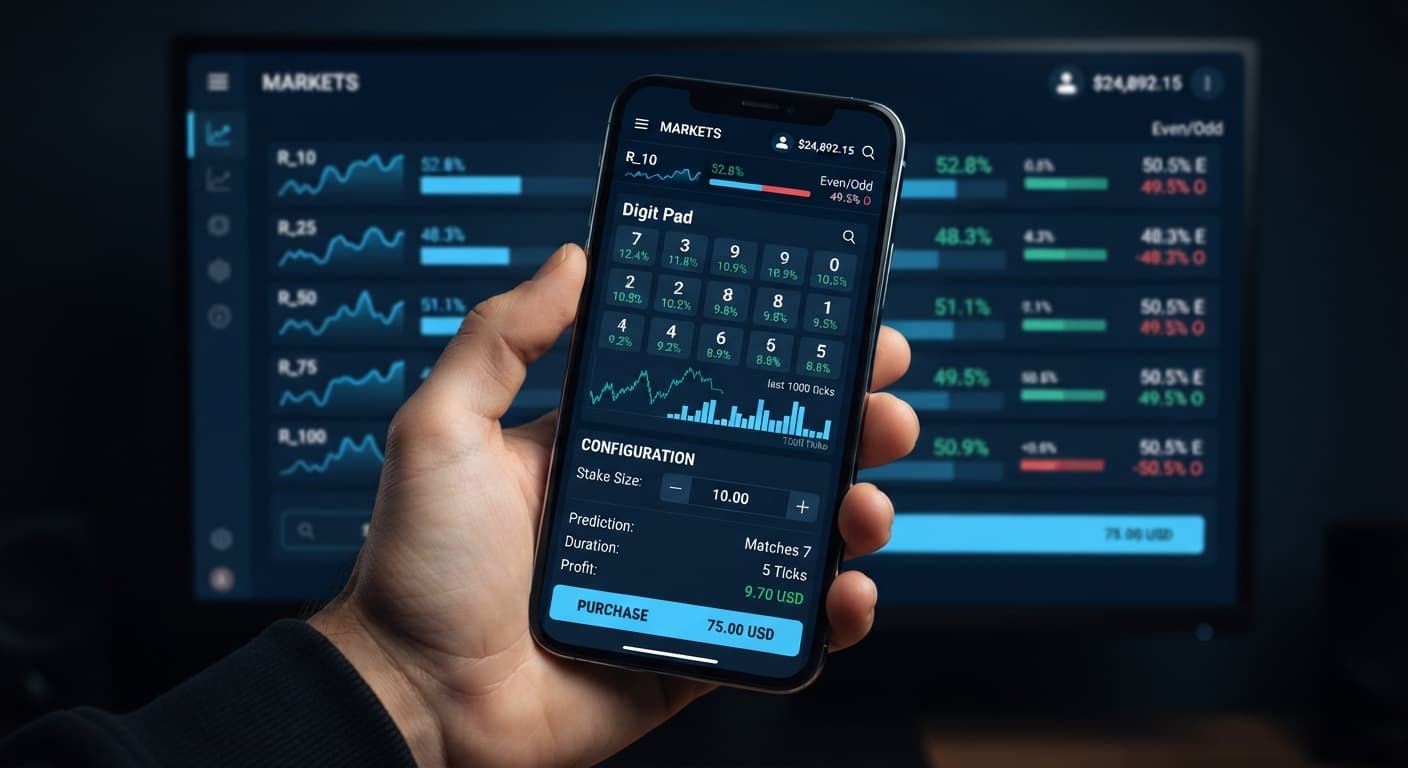
Select R_10 for market selection, set your stake, and define your digit target to use the digit pad on volatility 10 for manual trades.
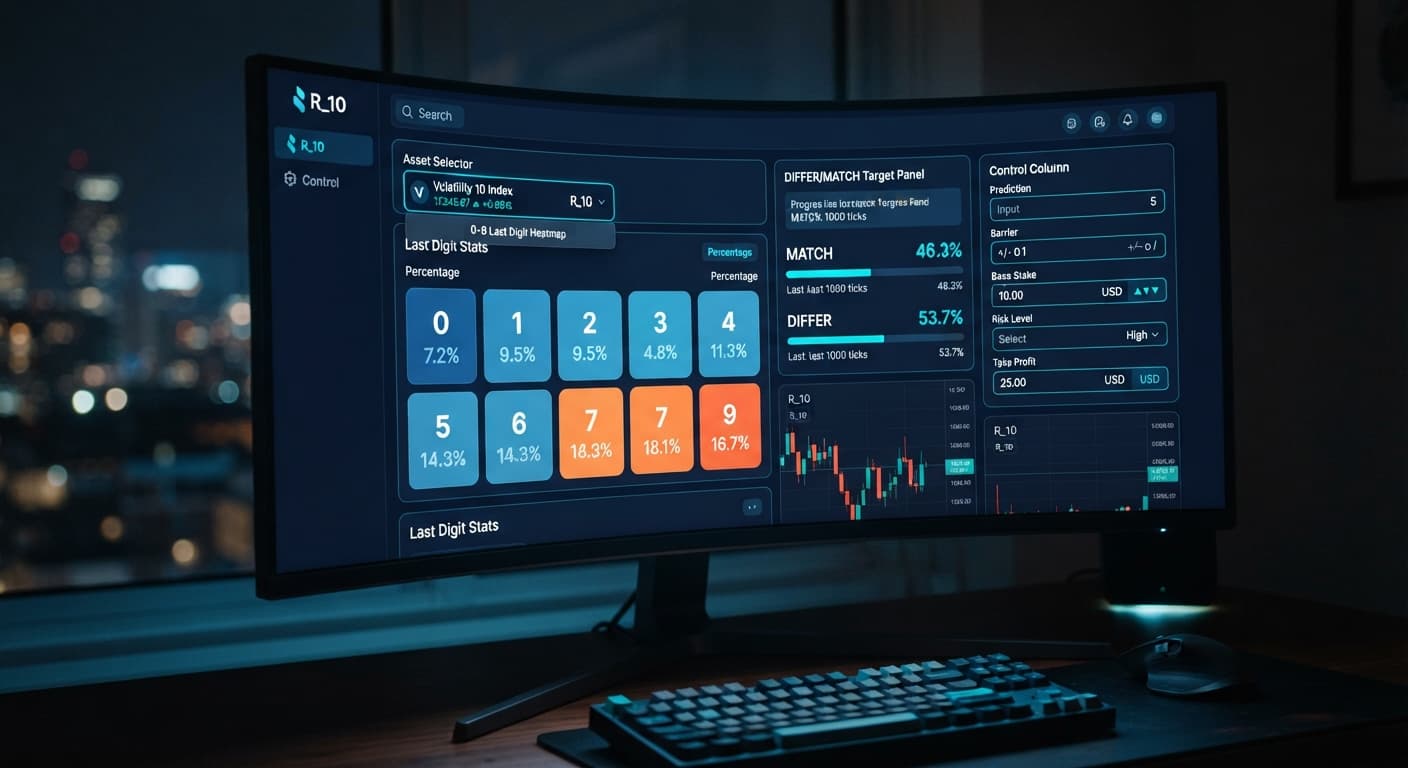
Free last-digit analysis for Deriv synthetic indices — read the 0-9 heatmap, spot DIFFER and MATCH targets, and turn digit frequency into an entry rule.
Page 1 of 4
Select R_10 for market selection, set your stake, and define your digit target to use the digit pad on volatility 10 for manual trades.
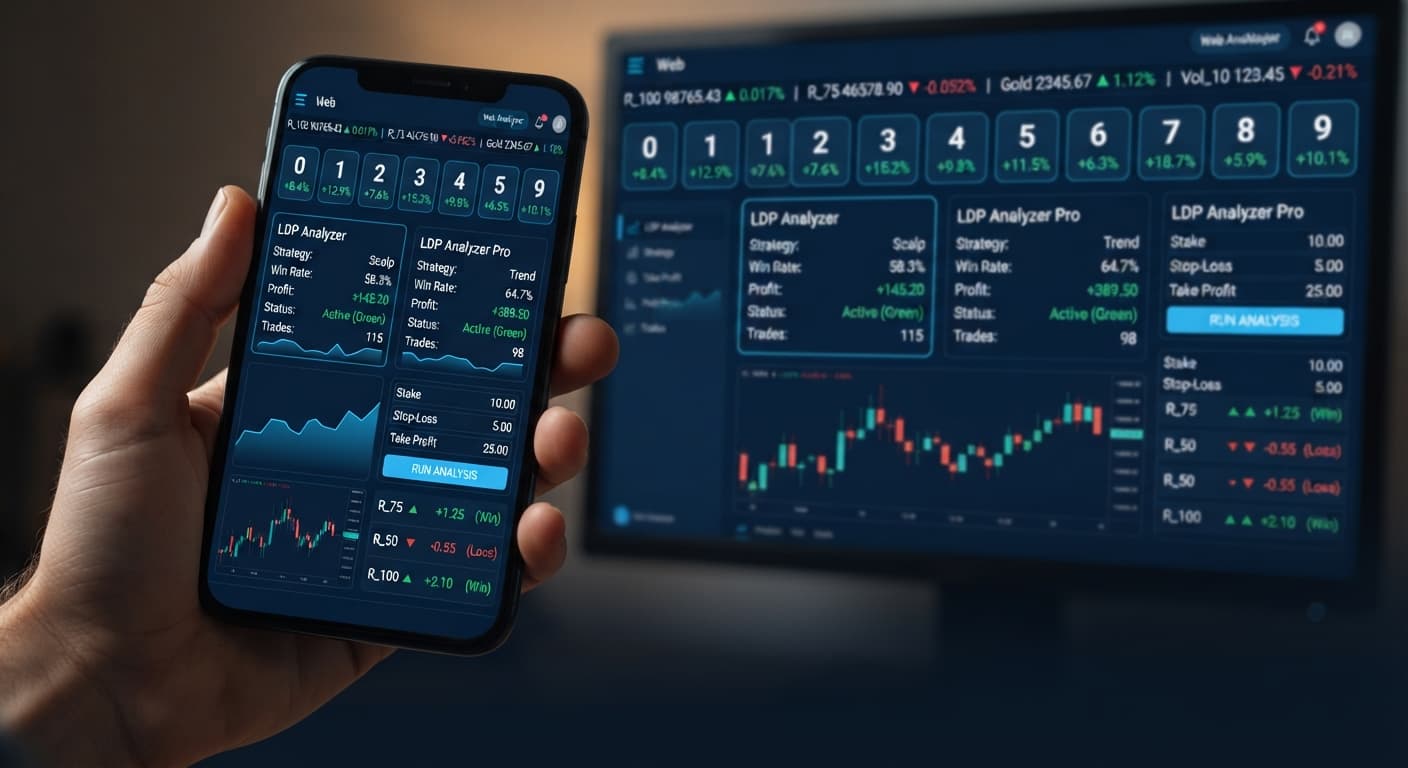
Comparing ldp analyzer vs ldp analyzer pro for Deriv. Choose standard for manual digit streams or Pro for 0-9 heatmaps and automated DIFFER execution.
Follow 3 simple steps to run ldp analyzer pro on volatility 10 by linking your Deriv token, setting predictions, and configuring risk controls.
If your digit pad keeps losing, fix it by avoiding past distribution assumptions, managing stakes, and adjusting for API tick speeds.
Set your ldp analyzer take profit settings to 2% to 5% of your total account balance or 2 to 4 times your stake to lock in automated gains.
Is LDP Analyzer Pro safe? Technically yes via API security, but financial risk remains high if you run unchecked stake recovery setups.
Read this ldp analyzer deriv bots guide to connect your token, configure digit analysis, and run automated trades safely. Start automating today.
Follow this ldp analyzer pro deriv bots guide to configure AutoPilot and risk controls for precise digit analysis on Deriv. Start trading smarter today.
Is your digit pad not working on Deriv? Fix API token and WebSocket dropouts while monitoring volatility indices with our troubleshooting guide.
Discover why your ldp analyzer keeps losing on Deriv bots. Learn how to fix stake sizes, stop loss, and take profit settings. Test strategies for free today.
Compare ldp analyzer pro vs solid trading bot on Deriv synthetic indices. Learn live 0-9 heatmap analysis versus rule-based execution. Test it today.
Read our ldp analyzer pro review to evaluate the 0-9 heatmap accuracy, digit analysis features, and risk controls for Deriv synthetic indices.
If you searched for a Deriv analysis tool, you probably want one thing: to see how often each last digit from 0 to 9 has come up before you pick a Digit Differs, Match, Even/Odd or Over/Under trade. BinaryBot.live has three free tools for that, and they're built for different jobs.
| Tool | What you see | Contracts | Best for |
|---|---|---|---|
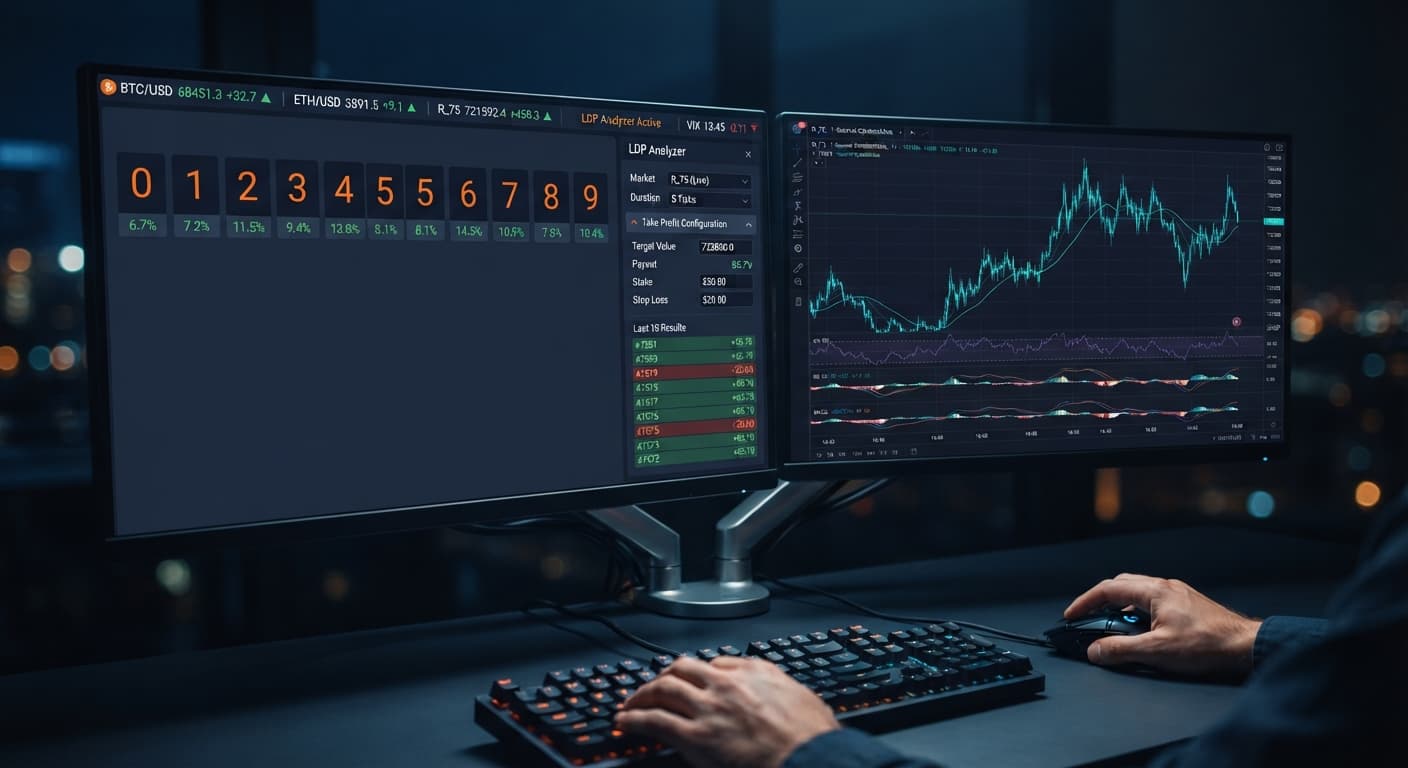
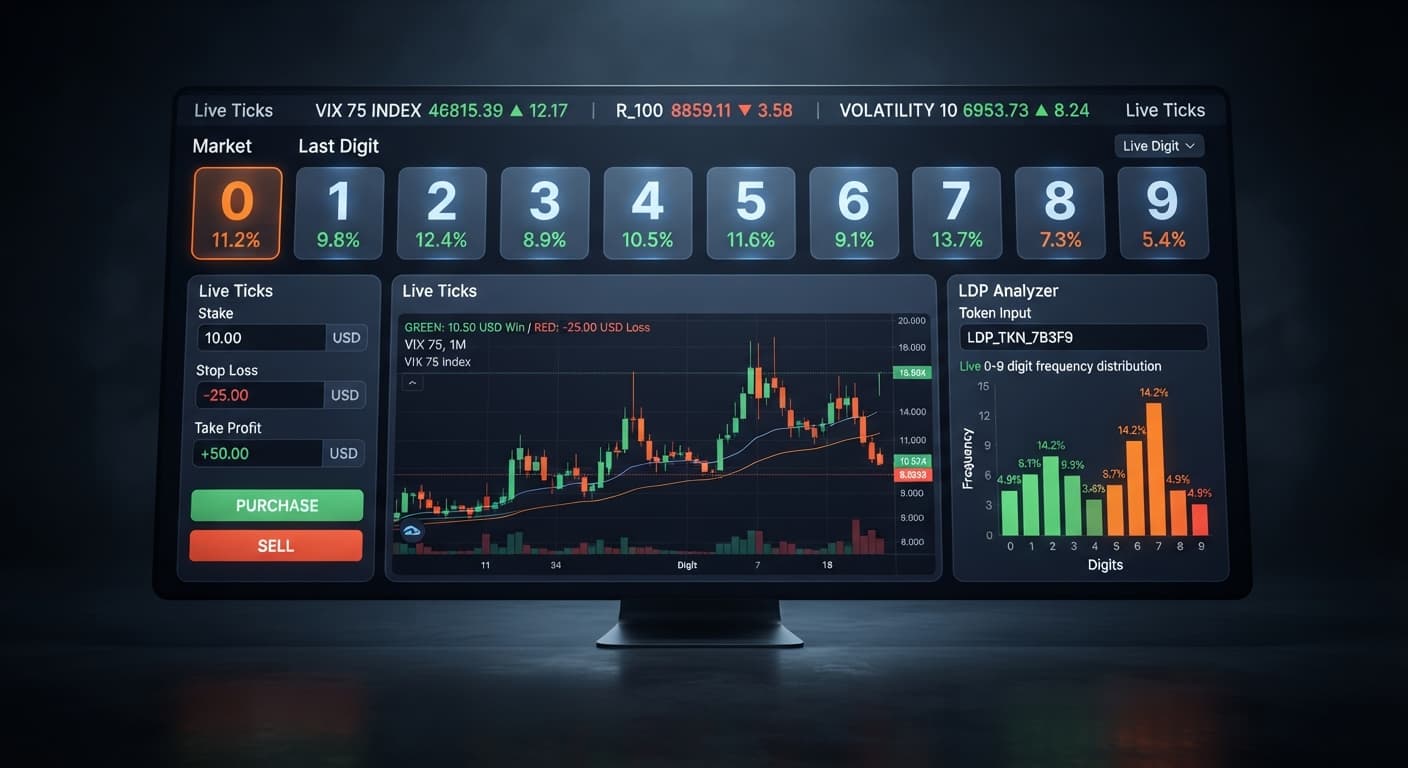
| LDP Analyzer | A live breakdown of the last digit of each tick | Digit Differs, Digit Match, Even/Odd, Over/Under, with automated execution | A first look at digit stats on one market |
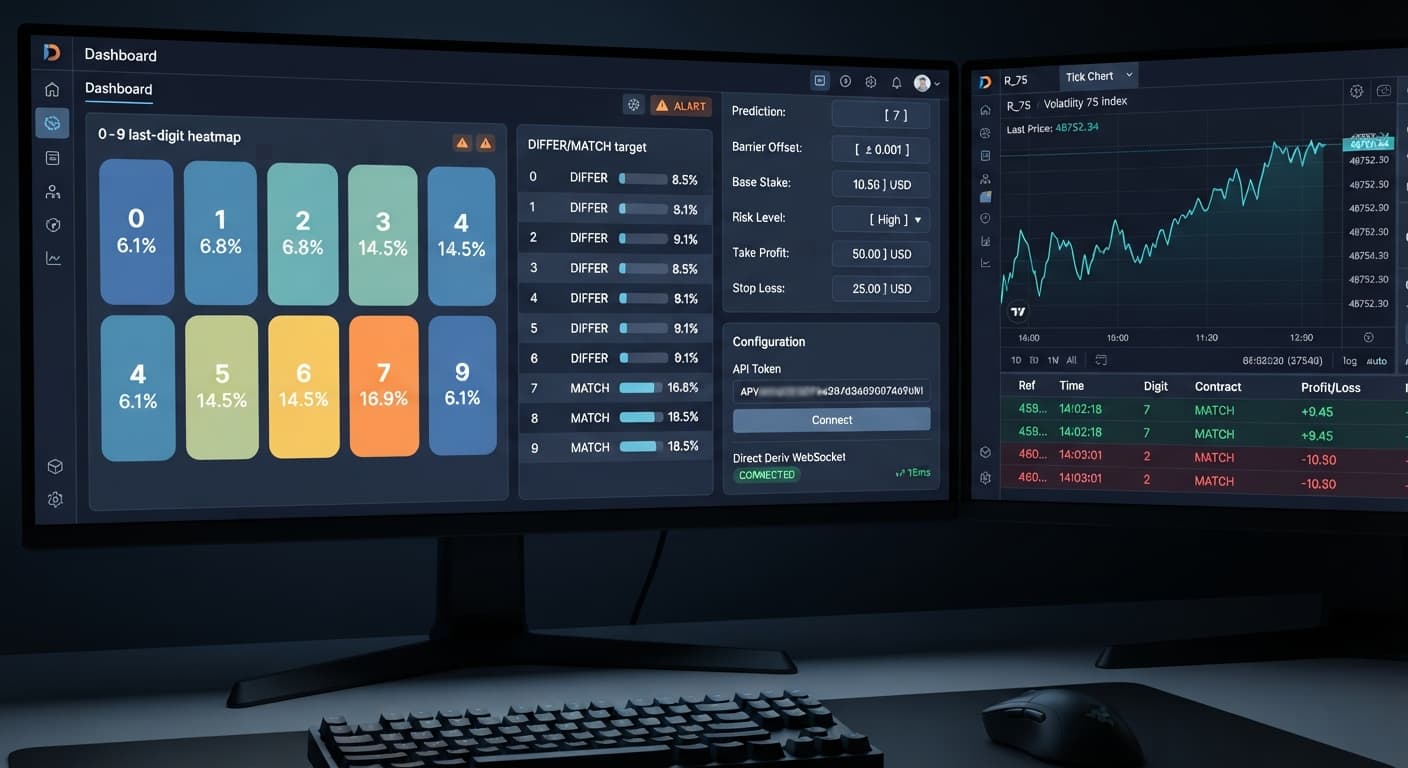
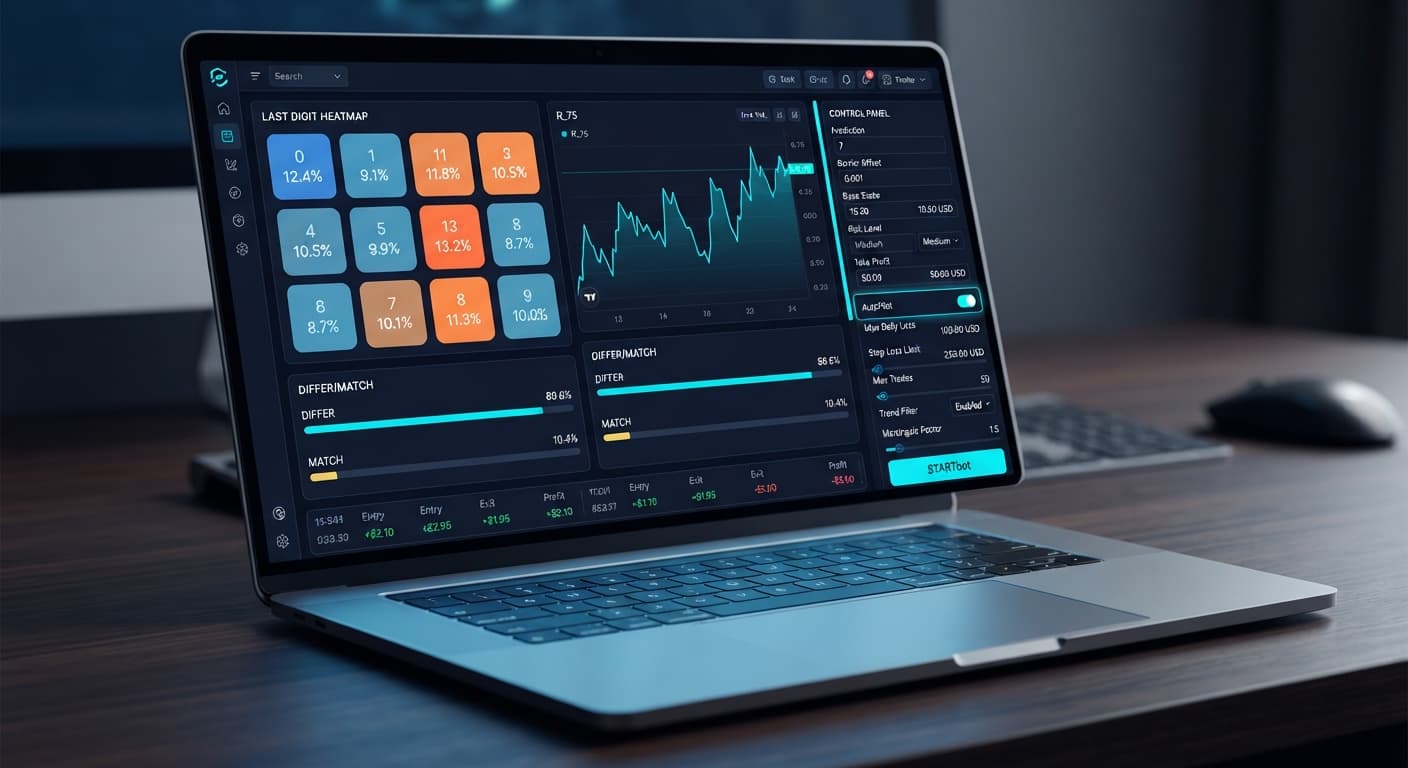
| LDP Analyzer Pro | A 0-9 heatmap coloured by frequency, plus DIFFER and MATCH targets with their hit percentages | The same digit contracts plus Rise/Fall, with an auto-trader and a server-side AutoPilot option | Picking a Differs or Match target and letting it trade with Risk Level and Take Profit set |
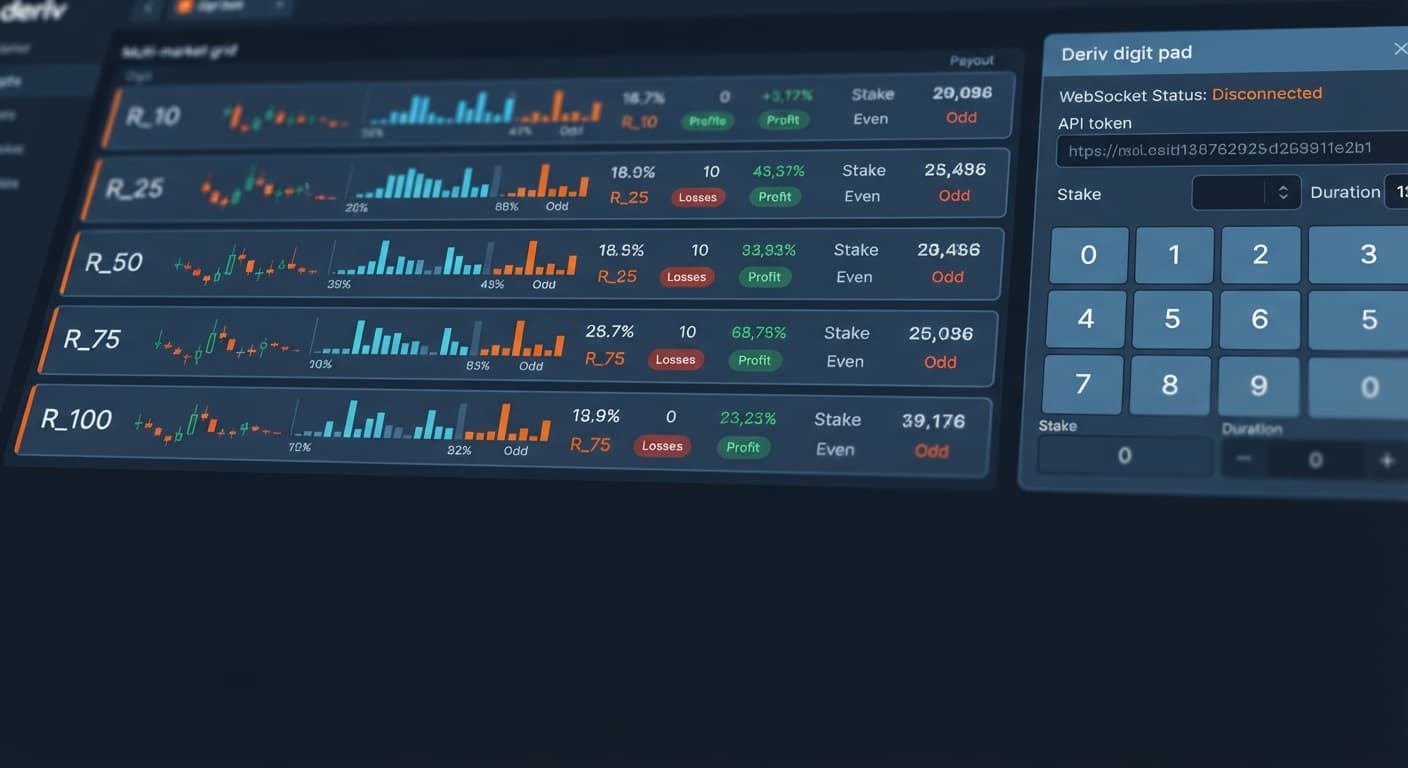
| Digit Pad | Digit distribution and the even/odd split for R_10, R_25, R_50, R_75 and R_100 side by side | Digit Differs and Even/Odd, placed by hand | Comparing five markets at once |
One thing none of them can do is predict the next digit. Deriv's ticks are independent, so a digit that's shown up 7% of the time over the last 1,000 ticks still has about a 10% chance on the next one. The numbers are useful for something else: checking your settings against what the market actually did.
Sample size matters more than colour. Every digit's true chance is 10%, and random variation alone moves the percentages you see:
| Ticks in the sample | Where most digits land (about 95% of the time) |
|---|---|
| 100 | 4% to 16% |
| 500 | 7% to 13% |
| 1,000 | 8% to 12% |
So a "cold" digit at 6% after 100 ticks is ordinary noise, not a signal. At 1,000 ticks a digit sitting outside 8% to 12% is unusual, but it still doesn't tell you what comes next.
The LDP tools cover Volatility 10, 25, 50, 75 and 100 and their 1s versions. Digit Pad shows the same five indices by their API symbols, R_10 to R_100. The 1s indices tick once a second, so a 1,000-tick sample builds in under 17 minutes. For how the markets differ, see the synthetic indices guides.
Yes. LDP Analyzer, LDP Analyzer Pro and Digit Pad are all free and run in your browser. You connect them with your own Deriv API token, and they work on a demo account.
No. Synthetic index ticks are independent, so past digit frequency doesn't change the next tick's odds. Analysis helps you choose and check settings; it can't forecast the next digit.
LDP Analyzer is the entry-level tool with a live last-digit breakdown. LDP Analyzer Pro adds the 0-9 heatmap, DIFFER and MATCH targets with hit percentages, Rise/Fall, and an auto-trader with Risk Level, Take Profit and Stop Loss.
No. Both LDP tools run in the browser on binarybot.live, so there's no app or file to install. Open the page, paste your Deriv API token and choose a market.